• Skip to primary navigation
  • Skip to main content
  • Skip to primary sidebar
  • Skip to footer
Hardware Secrets

Hardware Secrets

Uncomplicating the complicated

  • Case
  • Cooling
  • Memory
  • Mobile
    • Laptops
    • Smartphones
    • Tablets
  • Motherboard
  • Networking
  • Other
    • Audio
    • Cameras
    • Consumer Electronics
    • Desktops
    • Museum
    • Software
    • Tradeshows & Events
  • Peripherals
    • Headset
    • Keyboard
    • Mouse
    • Printers
  • Power
  • Storage
Home » A10-7800 CPU Review

A10-7800 CPU Review

[nextpage title=”Introduction”]

The AMD A10-7800 is a mainstream desktop CPU (or APU, as the manufacturer calls it), altough it is one the most expensive processors available for the platform FM2+. The A-series 7xxx CPUs are codenamed “Kaveri”, and they are more energy-efficient than the previous generation, “Richland”. The A10-7800 has a 65 W TDP, which can be lowered to 45 W (at expense of a lower maximum clock rate), if the BIOS of your motherboard supports this option. The A10-7800 is based on a microarchitecture called “Steamroller” and, as mentioned, it uses the FM2+ socket.

We will compare the A10-7800 with the A10-6800K and the Core i3-4150, which are also quad-core CPUs available more or less in the same price range. We also included the A6-6400K and the Pentium G3220, two low-end, dual-core CPUs that make use of the same platforms, just to give you an ideia of how faster are more expensive processors compared to the more inexpensive models.

Figure 1 unveils the A10-7800 CPU.

A10-7800
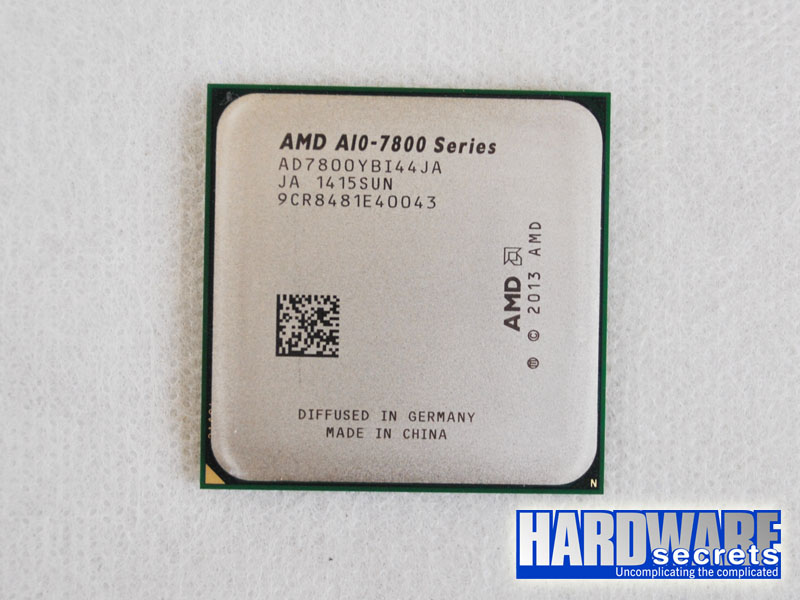
Figure 1: the A10-7800 CPU

Let’s compare the main specs of the tested CPUs in the next page.

[nextpage title=”The Reviewed CPUs”]

Altough the A10-7800, the A10-6800K, and the Core i3-4150 are not competitors to the A6-6400K and the Pentium G3220, we included the data collected for these two CPUs, which were tested under the same methodology, in order to show the performance difference between mainstream and value CPUs that make use of the same platform.

In the tables below, we compare the main features of the CPUs included in our review.

CPU Cores HT IGP Internal Clock Turbo Clock Base Clock Core Tech. TDP Socket Price
A10-7800 4 No Yes 3.5 GHz 3.9 GHz 100 MHz Kaveri 28 nm 65 W FM2+ USD 146
A10-6800K 4 No Yes 4.1 GHz 4.4 GHz 100 MHz Richland 32 nm 100 W FM2 USD 130
Core i3-4150 2 Yes Yes 3.5 GHz – 100 MHz Haswell 22 nm 54 W LGA1150 USD 123
A6-6400K 2 No Yes 3.9 GHz 4.1 GHz 100 MHz Richland 32 nm 65 W FM2 USD 53
Pentium G3220 2 No Yes 3.0 GHz – 100 MHz Haswell 22 nm 53 W LGA1150 USD 53

Prices were researched at Newegg.com on the day we published this review. TDP stands for Thermal Design Power and states the maximum amount of heat the CPU can dissipate.

Below you can see the memory configuration for each CPU.

CPU L2 Cache L3 Cache Memory Support Memory Channels

A10-7800

2 x 2 MiB – Up to DDR3-2133 Two

A10-6800K

2 x 2 MiB – Up to DDR3-2133 Two

Core i3-4150

2 x 256 kiB 3 MiB Up to DDR3-1600 Two
A6-6400K 1 MiB – Up to DDR3-1866 Two
Pentium G3220 2 x 256 kiB 3 MiB Up to DDR3-1333 Two

Below we have a quick comparison of the video engine of the CPUs.

CPU Video Engine DirectX Clock Cores

A10-7800

Radeon R7 11.1 720 MHz 512

A10-6800K

Radeon HD 8670D 11.0 844 MHz 384

Core i3-4150

HD 4400 11.1 350 MHz/1150 MHz 20
A6-6400K Radeon HD 8470D 11.0 800 MHz 192
Pentium G3220 Intel HD 11.1 350 MHz/1100 MHz 10

[nextpage title=”How We Tested”]

During our benchmarking sessions, we used the configuration listed below. Between our benchmarking sessions, the only variable device was the CPU being tested and the motherboard, which had to be replaced to match the different CPU sockets.

Hardware Configuration

  • Motherboard (socket LGA1150): ASRock Z97 Extreme4
  • Motherboard (socket FM2+): ASRock FM2A88X Extreme6+
  • CPU Cooler: AMD/Intel stock
  • Memory (DDR3): 16 GiB DDR3 G.Skill Sniper 1866, two F3-1866C10D-16GSR 8 GiB memory modules configured at 1,866 MHz
  • Boot drive: Kingston HyperX Fury 240 GB
  • Video Card: integrated
  • Video Monitor: Philips 236VL
  • Power Supply: Zalman ZM400-LE

Operating System Configuration

  • Windows 7 Home Premium 64-bit
  • NTFS
  • Video resolution: 1920 x 1080 60 Hz (desktop), 1280 x 720 (games)

Driver Versions

  • AMD driver version: 14.12
  • Intel Inf chipset driver version: 10.0

Software Used

  • 3DMark 1.4.828
  • Adobe Photoshop CC + Retouch Artist Speed Test 1.0
  • Cinebench R15
  • DivX 10.2.4
  • DVD Shrink 3.2
  • Media Espresso 6.7
  • PCMark 8 2.2.282
  • F1 2013

Error Margin

We adopted a 4% error margin. Thus, differences below 4% cannot be considered relevant. In other words, products with a performance difference below 4% should be considered as having similar performance.

[nextpage title=”PCMark 8″]

PCMark 8 is a benchmarking software that uses real-world applications to measure the computer performance. We ran three tests: Home, which includes web browsing, writing, light gaming, photo editing, and video chat tests; Creative, which includes web browsing, photo editing, video editing, group video chat, media transcoding, and gaming; and Work, which runs tasks such as writing documents, web browsing, spreadsheets, editing, and video chatting. Let’s analyze the results.

A10-7800

On the Home benchmark, the A10-7800 was 17% faster than the A6-6400K, as fast as the Pentium G3220, 5% slower than the A10-6800K, and 10% slower than the Core i3-4150.

 A10-7800

On the Creative benchmark, the A10-7800 was 31% faster than the A6-6400K, as fast as the A10-6800K and the Pentium G3220, and 16% slower than the Core i3-4150.

A10-7800

On the Work benchmark, the A10-7800 was as fast as the A6-6400K and 5% slower than the A10-6800K, 17% slower than the Core i3-4150, and 9% slower than the Pentium G3220.

[nextpage title=”3DMark”]

3DMark is a program with a set of benchmarks that create 3D scenarios and simulations.

The 3DMark Fire Strike benchmark measures DirectX 11 performance, and is aimed at high-end gamer PCs. The Sky Diver benchmark also measures DirectX 11 performance, but is more suitable to mainstream computers. The 3DMark Cloud Gate benchmark measures DirectX 10 performance, running at 1280×720 resolution.

We used the CPU’s integrated video controller.

A10-7800

On the Fire Strike benchmark, the integrated GPU of the A10-7800 was 37% faster than the A10-6800K’s, 114% faster than the Core i3-4150’s, 138% faster than the A6-6400K’s, and 247% faster than the Pentium G3220’s.

 A10-7800

On the Sky Diver benchmark, the integrated GPU of the A10-7800 was 42% faster than the A10-6800K’s, 110% faster than the Core i3-4150’s, 136% faster than the A6-6400K’s, and 187% faster than the Pentium G3220’s.

 A10-7800

On the Cloud Gate benchmark, the integrated GPU of the A10-7800 was 6.5% faster than the A10-6800K’s, 18% faster than the Core i3-4150’s, 80% faster than both the A6-6400K’s and the Pentium G3220’s.

[nextpage title=”Cinebench R15″]

Cinebench R15 is based on the 3D software Cinema 4D. It is very useful to measure the performance gain given by having more than one CPU installed on the system when rendering heavy 3D images. Rendering is one area in which having more than one CPU helps considerably, because usually, rendering software recognizes several CPUs. (Cinebench, for instance, can use up to 256 CPUs.)

Of course, none of the reviewed CPUs is targeted at rendering, but we included this test since it gives a good idea of muti core performance.

Since we were interested in measuring the rendering performance, we ran the CPU test, which renders a “heavy” sample image using all available CPUs or “cores” – either real or virtual – to speed up the process. The resut is given as a score.

 A10-7800

Here the A10-7800 was 103% faster than the A6-6400K, 30% faster than the Pentium G3220, 10% slower than the A10-6800K, and 14% slower than the Core i3-4150.

[nextpage title=”DivX”]

We used the DivX converter, a tool included in the DivX package, in order to measure the encoding performance using this codec. The DivX codec is, at least theorethically, capable of recognizing and using all available cores and the SSE4 instruction set.

We converted a Full HD, six-minute long .mov video file into a .avi file, using the “HD 1080p” output profile.

The results below are given in seconds, so the lower the better.

A10-7800

On DivX encoding, the A10-7800 was 88% faster than the A6-6400K, performed the same way as the A10-6800K, and was 20% slower than the Core i3-4150, and 7% slower than the Pentium G3220.

[nextpage title=”DVDShrink”]

DVDShrink is an old but still very useful program to “shrink” video DVDs that have more than 4.7 GiB of data to fit single-layer DVD media. We used it to compress the DVD of “The Lord of the Rings: The Fellowship of the Ring” DVD to 4.7 GiB. The results below are given in seconds, so the lower the better.

A10-7800

In this test, the A10-7800 was 73% faster than the A6-6400K, 45% faster than the Pentium G3220, achieved the same performance level of the Core i3-4150, and was 7% slower than the A10-6800K.

[nextpage title=”Media Espresso 6.7″]

Media Espresso is a video conversion program that uses the graphics processing unit of the video engine to speed up the conversion process. We converted a 1 GiB, 1920x1080i, 23,738 kbps, .mov video file to a smaller 320×200, H.264, .MP4 file for viewing on a smartphone. The results below are given in seconds, so the lower the better.

A10-7800

Here the A10-7800 was 8% faster than the A6-6400K, 7% slower than the A10-6800K, 12% slower than the Pentium G3220, and 23% slower than the Core i3-4150.

[nextpage title=”Photoshop CC”]

The best way to measure performance is by using real-world programs. The problem, though, is creating a methodology that provides accurate results. For Photoshop CC, we used a script called “Retouch Artist Speed Test,” which applies a series of filters to a sample image and gives us the time that Photoshop took to run all the filters. The results below are given in seconds, so the lower the number the better.

We did not run this test on the A6-6400K and on the Pentium G3220, so we are not including them in this comparison.

A10-7800

 In this test, the A10-7800 was as fast as the A10-6800K and 18% slower than the Core i3-4150.

[nextpage title=”Battlefield 4″]

Battlefield 4 is an installment in the Battlefield franchise, released in 2013. It is based on the Frostbite 3 engine, which is DirectX 11. In order to measure of the integrated GPU performance using this game, we walked our way through the first mission, measuring the number of frames per second three times using FRAPS. We ran this game at 1280 x 720, setting overall image quality at “medium.”

The results below are expressed in frames per second and are an arithmetic average of the three results collected.

We did not run this game on the A6-6400K and on the Pentium G3220.

A10-7800

In this game, the A10-7800 was 30% faster than the A10-6800K and 71% faster than the Core i3-4150.

[nextpage title=”F1 2013″]

F1 2013 is a car racing game released in 2013, based on the Formula One championship and using the EGO 3.0 engine.

We tested the performance in this game using the built-in performance test, using “ultra low” quality settings and 1280 x 720 screen resolution.

The results below are expressed in frames per second.

We used the CPU’s integrated video controller.

A10-7800

On F1 2013, the A10-7800 was 68% faster than the A6-6400K and 204% faster than the Pentium G3220, achieved a similar performance as the Core i3-4150, and was 24% slower than the A10-6800K.

[nextpage title=”Far Cry 3″]

Far Cry 3 is based on the Dunia 2 engine, which is DirectX 11. In order to measure performance using this game, we played the same mission three times, measuring the number of frames per second using FRAPS. We ran this game at the lowest possible settings, using 1280 x 720 resolution, and overall image quality at “medium.”

The results below are expressed in frames per second and are an arithmetic average of the three results collected.

We did not run this game on the A6-6400K and on the Pentium G3220.

A10-7800

Far Cry 3 ran 21% faster on the A10-7800 than on the A10-6800K, and 96% faster than on the Core i3-4150.

[nextpage title=”Conclusions”]

When we tested the A10-6800K and the Core i3-4150, we concluded that the Core i3-4150 had more CPU power, but the A10-6800K had a better integrated GPU, and could be good for casual gaming if you intended to use its integrated video (i.e., not install an add-on video card).

On one hand, the A10-7800 proved to have a little less computing power than the A10-6800K on most applications, probably due to its lower clock rate. On the other hand, its Radeon R7 integrated GPU is substantially more powerful than the A10-6800K’s, which is shown in 3DMark tests and in most games we ran.

Allied to the lower TDP (which can be lowered to 45W if your BIOS supports this configuration) than the A10-6800K, this leads us to conclude that the A10-7800 is an excellent option if you are only going to use the processor’s integrated GPU, and you are looking for good performance for multimedia, HTPC, or casual gaming.

However, if you intend to use a discrete video card, there is no much sense in buying an A10-7800 processor; in this case, the Core i3-4150 is a better option.

Reader Interactions

Leave a Reply Cancel reply

Your email address will not be published. Required fields are marked *

Primary Sidebar

As a participant in the Amazon Services LLC Associates Program, this site may earn from qualifying purchases. We may also earn commissions on purchases from other retail websites.

car service

Why Is Fleet Maintenance Important?

If you have a fleet of vehicles you use within your business, it’s crucial you keep up with their

Playing Fifa on Play station 4

Tips for Recycling Your Gaming Consoles and Devices

These days, it seems like almost everybody is gaming. As great as this is, it’s also creating a

Business planning

How to Develop Your Venture Capital Business

Venture Capital (VC) is a type of private equity investment in which investors provide funding to

Footer

For Performance

  • PCI Express 3.0 vs. 2.0: Is There a Gaming Performance Gain?
  • Does dual-channel memory make difference on integrated video performance?
  • Overclocking Pros and Cons
  • All Core i7 Models
  • Understanding RAM Timings

Everything you need to know

  • Everything You Need to Know About the Dual-, Triple-, and Quad-Channel Memory Architectures
  • What You Should Know About the SPDIF Connection (2022 Guide)
  • Everything You Need to Know About the Intel Virtualization Technology
  • Everything You Need to Know About the CPU Power Management

Copyright © 2023 · All rights reserved - Hardwaresecrets.com
About Us · Privacy Policy · Contact