• Skip to primary navigation
  • Skip to main content
  • Skip to primary sidebar
  • Skip to footer
Hardware Secrets

Hardware Secrets

Uncomplicating the complicated

  • Case
  • Cooling
  • Memory
  • Mobile
    • Laptops
    • Smartphones
    • Tablets
  • Motherboard
  • Networking
  • Other
    • Audio
    • Cameras
    • Consumer Electronics
    • Desktops
    • Museum
    • Software
    • Tradeshows & Events
  • Peripherals
    • Headset
    • Keyboard
    • Mouse
    • Printers
  • Power
  • Storage
Home » A10-5800K vs. Core i3-3220 CPU Review

A10-5800K vs. Core i3-3220 CPU Review

[nextpage title=”Introduction”]

This week AMD released its latest generation of CPUs with integrated video, dubbed “Trinity.” The A10-5800K is currently the most high-end model available, running at 3.8 GHz and costing USD 130. Let’s see how it fares against its main competitor, the Core i3-3220 (3.3 GHz, USD 130). We also included in our comparison the AMD APU that used to be the most high-end model, the A8-3870K (3 GHz, USD 110 currently, USD 145 at its release) and what was then its main competitor, the Core i3-2105 (3.1 GHz, USD 135).

It is interesting to see AMD starting to use the same letter as Intel to indicate its CPUs with an unlocked clock multiplier, “K.”

This new generation of AMD APUs, dubbed “Trinity,” uses a new CPU socket, called FM2, which is incompatible with the FM1 socket used by the previous generation of APUs (codenamed “llano”). They are physically different, so it is not possible to install an FM1 CPU into an FM2 socket or an FM2 CPU into an FM1 socket. The two Core i3 CPUs included in our review use the LGA1155 socket. In Figures 1 and 2, you can compare the physical aspect of the four CPUs included in our review.

AMD A10-5800K APU
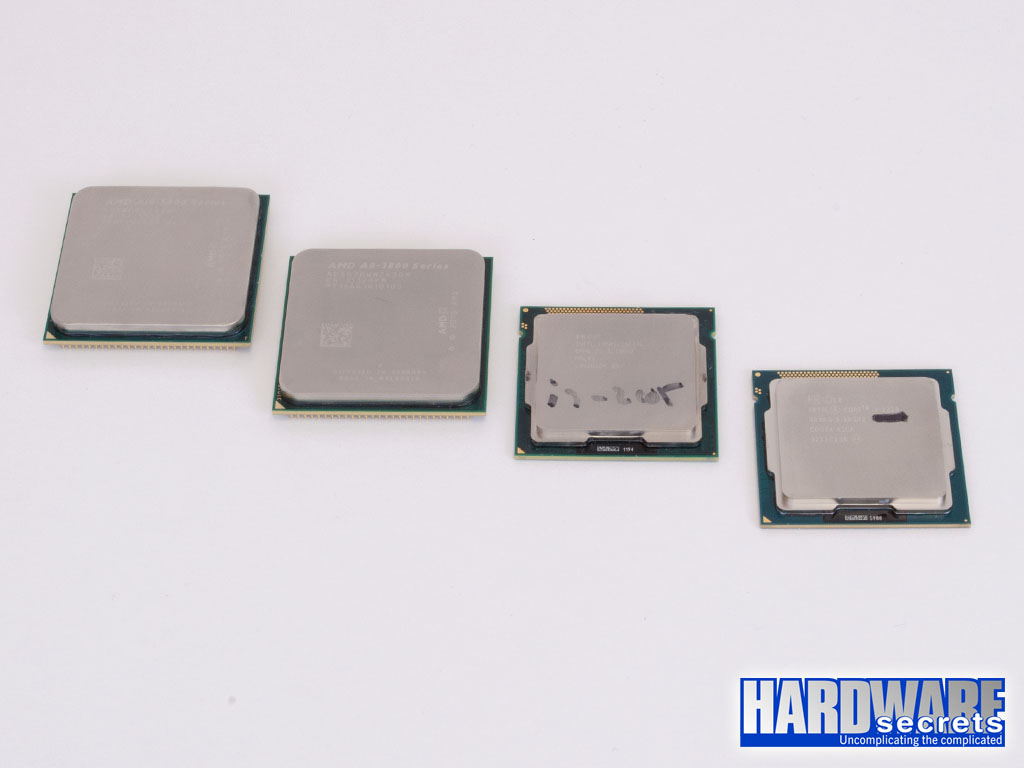
Figure 1: The A10-5800K, the A8-3870K, the Core i3-2105, and the Core i3-3220

AMD A10-5800K APUFigure 2: The A10-5800K, the A8-3870K, the Core i3-2105, and the Core i3-3220

[nextpage title=”The Reviewed CPUs”]

In the tables below, we compare the main features of the CPUs included in our review. The new A10-5800K finally brings support for the SSE4 instruction set (both SSE4.1 and SSE4.2), and it also supports the AVX instruction set. More importantly, it has a “turbo clock” technology, which was not available on the previous generation and is not available on Intel’s Core i3 processor line. The Intel CPUs included in our review are dual-core, but since they support Hyper-Threading (HT) technology, which simulates one additional core per CPU physical core, the operating system “sees” these CPUs as having four cores.

It is important to understand that with the second-generation APUs from AMD, each pair of CPU cores share the same front-end engine (i.e., the fetch unit, the L1 instruction cache, and the instruction decoders). So, each pair of CPU cores is part of the same “module,” and the A10-5800K is comprised of two of these modules. This concept was introduced with the AMD “Bulldozer” architecture, used on AMD’s FX processor line, and adopted on the “Piledriver” architecture used by the second-generation APUs. With the other CPUs included in our review, each core is a complete CPU, each with its own front-end engine.

CPU Cores HT SSE4 AVX IGP Internal Clock Turbo Clock Base Clock Codename Tech. TDP Socket Price
A10-5800K 4 No Yes Yes Yes 3.8 GHz 4.2 GHz 100 MHz Trinity 32 nm 100 W FM2 USD 130
A8-3870K 4 No No No Yes 3.0 GHz No 100 MHz Llano 32 nm 100 W FM1 USD 110
Core i3-2105 2 Yes Yes Yes Yes 3.1 GHz No 100 MHz Sandy Bridge 32 nm 65 W LGA1155 USD 135
Core i3-3220 2 Yes Yes Yes Yes 3.3 GHz No 100 MHz Ivy Bridge 22 nm 55 W LGA1155 USD 130

Prices were researched at Newegg.com on the day we published this review. TDP stands for Thermal Design Power and states the maximum amount of heat the CPU can dissipate. The CPU cooler must be capable of dissipating at least this amount of heat.

Below you can see the memory configuration for each CPU.

CPU L1 Cache (I + D) L2 Cache L3 Cache Memory Support Memory Channels
A10-5800K 64 kB per module + 16 kB per core 2 MB x 2 No Up to DDR3-1866 Two
A8-3870K 64 kB + 64 kB per core 1 MB per core No Up to DDR3-1866 Two
Core i3-2105 32 kB + 32 kB per core 256 kB per core 3 MB total Up to DDR3-1333 Two
Core i3-3220 32 kB + 32 kB per core 256 kB per core 3 MB total Up to DDR3-1333 Two

Below we have a quick comparison of the video engine of the CPUs.

CPU Video Engine DirectX Clock Cores
A10-5800K Radeon HD 7660D 11 800 MHz 384
A8-3870K Radeon HD 6550D 11 600 MHz 400
Core i3-2105 Intel HD 3000 10.1 850 MHz/1.1 GHz 12
Core i3-3220 Intel HD 2500 11 650 MHz/1.05 GHz 6

[nextpage title=”How We Tested”]

During our benchmarking sessions, we used the configuration listed below. Between our benchmarking sessions, the only variable device was the CPU being tested and the motherboard, which had to be replaced to match the different CPU sockets.

Hardware Configuration

  • Motherboard (Socket FM2): MSI FM2-A85XA-G65 (1.0 B15 BIOS)
  • Motherboard (Socket FM1): Gigabyte GA-A75M-UD2H (F6c BIOS)
  • Motherboard (Socket LGA1155): ASRock Z77 Extreme4-M (1.30 BIOS)
  • CPU Cooler: Intel/AMD stock
  • Memory: 8 GB DDR3-1600, two AMD Entertainment Edition (AE34G1609U2) 4 GB memory modules
  • Hard Disk Drive: Hitachi Deskstar P7K500 500 GB (HDP725050GLA360)
  • Video Card: Sparkle GeForce GT 440 1 GB (some tests only, used on the FM2 platform)
  • Video Monitor: AOC e3343Fwk
  • Power Supply: OCZ StealthXStream 400 W

Operating System Configuration

  • Windows 7 Ultimate 64-bit
  • NTFS
  • Video resolution: 1920 x 1080 60 Hz

Driver Versions

  • AMD video driver version: Catalyst 12.8
  • Intel video driver version: 15.26.12.64.2761
  • Intel Inf chipset driver version: 9.3.0.1019

Software Used

    • 3DMark 11 Professional 1.0.3
    • Adobe After Effects CS4
    • Adobe Photoshop CS5 Extended + Retouch Artist Speed Test 1.0
    • Battlefield 3
    • Borderlands 2
    • Cinebench 11.529
  • Far Cry 2 – Patch 1.03
  • iTunes 10.2
  • Media Espresso 6.5
  • PCMark 7 1.0.4
  • Starcraft II: Wings of Liberty – Patch 1.5
  • VirtualDub 1.9.5 + MPEG-2 Plugin 3.1 + DivX 6.9.2
  • WinZip 16.5

Error Margin

We adopted a 3% error margin. Thus, differences below 3% cannot be considered relevant. In other words, products with a performance difference below 3% should be considered as having similar performance.

[nextpage title=”PCMark 7″]

PCMark 7 performs a series of tests and gives scores in the following categories: An overall score called PCMark; a Productivity score, which is the system performance when using applications such as web browsing and home office applications; a Creativity score, which is the system performance when viewing, editing, converting, and storing photos and videos; an Entertainment score, which is the system performance when recording, viewing, streaming, and converting TV shows and movies, importing, organizing, and browsing music, and gaming; and a Computation score, which indicates the processing performance of the system. Let’s analyze the results.

AMD A10-5800K APU

The Core i3-3220 achieved an overall score 10% higher than the one achieved by the A10-5800K. The new AMD APU achieved a score 14% higher than its predecessor, the A8-3870K.

AMD A10-5800K APU

On the productivity benchmark, the A10-5800K achieved a score 5% higher than the Core i3-3220, 17% higher than the Core i3-2105 and 23% higher than the A8-3870K.

AMD A10-5800K APU

On the creativity benchmark, the Core i3-3220 achieved a score 72% higher than the A10-5800K. The new APU achieved a score 10% higher than its predecessor, the A8-3870K.

AMD A10-5800K APU

On the entertainment benchmark, the A10-5800K and the Core i3-3220 achieved the same performance level. The new AMD APU achieved a score that was 8% higher than the A8-3870K and 34% higher than the Core i3-2105.

AMD A10-5800K APU

On the computation benchmark, the Core i3-3220 achieved a score 292% higher than the A10-5800K. The new AMD APU achieved a score 4% higher than the Core i3-2105and 16% higher than the A8-3870K.

[nextpage title=”VirtualDub”]

With VirtualDub, we converted a full-length DVD movie to DivX format and saw how long it took for this conversion to be completed. DivX codec is capable of recognizing and using not only more than one CPU (i.e., more than one core) but also the SSE4 instruction set.

The movie we chose to convert was “Star Trek – The Motion Picture: Director’s Cut.” We copied the movie to our hard disk drive with no compression, so the final original file on our HDD was 6.79 GB. After compressing it with DivX, the final file was only 767.40 MB, which is quite remarkable.

The results below are given in seconds, so the lower the better.

AMD A10-5800K APU

On DivX encoding, the Core i3-3220 was 13% faster than the A10-5800K, which achieved the same performance level as the Core i3-2105 and  the A8-3870K.

[nextpage title=”Photoshop CS5″]

The best way to measure performance is by using real programs. The problem, though, is creating a methodology using real software that provides accurate results. For Photoshop CS5, we used a script called “Retouch Artist Speed Test,” which applies a series of filters to a sample image and gives us the time that Photoshop took to run all the filters. The results below are given in seconds, so the lower the number the better.

AMD A10-5800K APU

On Photoshop CS5, the Core i3-3220 was 25% faster than the A10-5800K, while the Core i3-2105 was 13% faster than the new AMD APU, which was 10% faster than the A8-3870K.

[nextpage title=”After Effects CS4″]

After Effects is a very well-known program for video post-production, to add animation and visual effects in videos. To evaluate the performance of each CPU running this program, we ran a workload consisting of a number of compositions that applied several filters and effects to a variety of input file types such as PSD (Photoshop), AI (Illustrator), EPS and TIF. After each filter was applied, the composition was rendered to an uncompressed AVI file with the same resolution as the input files. The results below are the time each CPU took to finish the whole batch, given in seconds, so the lower the number the better.

AMD A10-5800K APU

On After Effects CS4, the Core i3-3220 was 18% faster than the A10-5800K, while the Core i3-2105 was 10% faster than the new AMD APU, which was 9% faster than the A8-3870K.

[nextpage title=”Media Espresso 6.5″]

Media Espresso is a video conversion program that uses the graphics processing unit of the video card to speed up the conversion process. It is also capable of using Intel’s QuickSync technology available in the CPUs from this company. We converted a 449 MB, 1920x1080i, 18,884 kbps, MPG2 video file to a smaller 640×360, H.264, .MP4 file for viewing on a portable device such as an iPhone or iPod Touch.

AMD A10-5800K APU

Here the Core i3-3220 was 33% faster than the A10-5800K, while the Core i3-2105 was 26% faster than the new AMD APU, which was 13% faster than the A8-3870K.

[nextpage title=”WinZip”]

We used WinZip not only to measure compression time, but also decryption time. We measured the time each CPU took to decompress and decrypt 200 JPEG images, 125 of them at 10 megapixels and 75 of them at six megapixels. The total size of all the photos was around 830 MB. The results below are given in seconds, so the lower the number the better.

AMD A10-5800K APU

Decompressing and decrypting files, the A10-5800K and the Core i3-3220 achieved the exact same performance. The A10-5800K was 9% faster than the Core i3-2105 and 26% faster than the A8-3870K.[nextpage title=”iTunes”]

We used iTunes to convert an uncompressed .wav file into a high-quality (160 Kbps) MP3 file, and checked how many seconds each CPU took to perform this operation. Therefore, the results below are given in seconds, so the lower the number the better.

AMD A10-5800K APU

Here the two CPUs from Intel were faster than their competitors from AMD. The Core i3-3220 was 17% faster than the A10-5800K, while the Core i3-2105 was 9% faster than this CPU. The A10-5800K was 4% faster than the A8-3870K.

[nextpage title=”Cinebench 11.5″]

Cinebench 11.5 is based on the 3D software Cinema 4D. It is very useful to measure the performance gain given by having more than one CPU installed on the system when rendering heavy 3D images. Rendering is one area in which having more than one CPU helps considerably, because usually, rendering software recognizes several CPUs. (Cinebench, for instance, can use up to 16 CPUs.)

Since we were interested in measuring the rendering performance, we ran the test called “Rendering x CPUs,” which renders a “heavy” sample image using all available CPUs or “cores” – either real or virtual – to speed up the process. (On CPUs with Hyper-Threading technology, each core is recognized as two cores by the operating system.)

A10-5800K vs. Core i3-3220 CPU Review

Here the advantage switched to the CPUs from AMD, since they are quad-core parts, while the CPUs from Intel are dual-core products with Hyper-Threading technology. The A10-5800K was 6% faster than the A8-3870K, 15% faster than the Core i3-3220, and 28% faster than the Core i3-2105.[nextpage title=”StarCraft II: Wings of Liberty”]

StarCraft II: Wings of Liberty is a very popular DirectX 9 game that was released in 2010. Though this game uses an old version of DirectX, the number of textures that can be represented on one screen can push most of the top-end graphics cards to their limits. StarCraft II: Wings of Liberty uses its own physics engine that is bound to the CPU and thus does not benefit from PhysX.

We tested this game at 1920×1080, configuring all image quality settings at their lowest values. We then used FRAPS to collect the frame rate of a replay on the “Unit Testing” custom map. We used a battle between very large armies to stress the video cards.

AMD A10-5800K APU

The performance level of the A10-5800K’s integrated video was impressive – 33% faster than a GeForce GT 440. It was 42% faster than the integrated video of the A8-3870K, 200% faster than the integrated video of the Core i3-3220, and 291% faster than the integrated video of the Core i3-2105.

[nextpage title=”Far Cry 2″]

Released in 2008, Far Cry 2 is based on a game engine called Dunia, which is DirectX 10. We used the benchmarking utility that comes with this game at 1920×1080, configuring all image quality settings at their lowest values, and running the “Ranch Long” demo three times. The results below are expressed in frames per second and are an arithmetic average of the three results collected.

AMD A10-5800K APU

The performance level of the A10-5800K’s integrated video on this DirectX 10 game was also impressive. It was 18% faster than a GeForce GT 440, 31% faster than the A8-3870K, 225% faster than the Core i3-3220, and 366% faster than the Core i3-2105. Basically, you are able to play this game comfortably with the A10-5800K, while you can’t play it with Intel’s integrated video.

[nextpage title=”DiRT3″]

DiRT3 is a DirectX 11 game. We measured performance using this game by running a race and then playing it back using FRAPS. We tested this game at 1920×1080, configuring all image quality settings at their lowest values.

AMD A10-5800K APU

On DiRT3, the A10-5800K once again blew away the competition. It was 28% faster than a GeForce GT 440, 38% faster than the A8-3870K, and 222% faster than the Core i3-3220. The Core i3-2105 is not capable of running this game, since its video engine is DirectX 10.1.

[nextpage title=”Battlefield 3″]

Battlefield 3 is the latest installment in the Battlefield franchise released in 2011. It is based on the Frostbite 2 engine, which is DirectX 11. In order to measure performance using this game, we walked our way through the first half of the “Operation Swordbreaker” mission, measuring the number of frames per second using FRAPS. We tested this game at 1920×1080, configuring all image quality settings at their lowest values.

AMD A10-5800K APU

The A10-5800K again achieved the highest performance; however, the frame rate was very low to play this game comfortably, even after reducing the image quality settings to their lowest. Here the A10-5800K was 22% faster than the GeForce GT 440, 31% faster than the A8-3870K, and 211% faster than the Core i3-3220. The Core i3-2105 is not capable of running this game, since its video engine is DirectX 10.1.

[nextpage title=”Borderlands 2″]

Borderlands 2 is a very recent game, released in 2012, supporting NVIDIA’s PhysX technology. We used the in-game benchmarking utility at 1920×1080, disabling PhysX and configuring all image quality settings at their lowest values.

AMD A10-5800K APU

The A10-5800K again achieved the highest performance; however, the frame rate was very low to play this game comfortably, even reducing the image quality settings to their lowest. Here the A10-5800K was 11% faster than the A8-3870K, 27% faster than the GeForce GT 440, and 136% faster than the Core i3-3220. The Core i3-2105 was not capable of running this game.

[nextpage title=”3DMark 11 Professional”]

3Mark 11 Professional measures Shader 5.0 (i.e., DirectX 11) performance. We ran this program at 1920×1080 using the “Entry” profile.

This program provides three different scores: graphics, physics and combined.

The Core i3-2105 is not able to run this program, since this CPU is not compatible with DirectX 11.

AMD A10-5800K APU

The A10-5800K achieved the highest graphics score, which was 21% higher than the A8-3870K, 24% higher than the GeForce GT 440, and 279% higher than the Core i3-3220.

AMD A10-5800K APU

The physics score measures exclusively the physics performance of the system, a process that is typically done on the CPU. Here the Core i3-3220 was the fastest CPU, with a score 7.4% higher than the one achieved by the A10-5800K, which achieved the same performance level as the A8-3870K.

AMD A10-5800K APU

The combined score shows a balance between the graphics and the physics performance achieved by each system being tested. Here the A10-5800K and the GeForce GT 440 achieved the same score level, which was 18% higher than the A8-3870K and 158% higher than the Core i3-3220.

[nextpage title=”Overclocking”]

We could achieve an outstanding overclocking level with the A10-5800K. Being an unlocked CPU, we could increase its clock multiplier up to x40, from its default of x38. We were also able to increase its base clock from 100 MHz to 108 MHz. Above that, our system would crash. This overclocking made our A10-5800K run at 4.32 GHz, from its default of 3.8 GHz, a 13.7% increase. In order to achieve these numbers, we had to increase the CPU voltage to 1.35 V (from the default of 1.25 V) and the CPU-NB voltage to 1.30 V.

We decided to install the liquid cooling solution from AMD, to see if we could achieve better results. And we did. With this CPU cooler, we could increase the clock multiplier to x41 and the base clock to 110 MHz, making our CPU to run at 4.51 GHz, a 18.7% increase over its default clock rate. For that, we increase the CPU voltage to 1.50 V and the CPU-NB voltage to 1.40 V.

With time and patience, we believe you will probably be able to achieve even better results.

[nextpage title=”Conclusions”]

The new A10-5800K is a far better CPU than the A8-3870K, and it costs less than what the A8-3870K did when it was launched. Both processing performance and gaming performance were improved on the new processor.

On gaming, the A10-5800K leaves its main competitor, the Core i3-3220, in the dust, as it is between two and three times faster. In fact, the A10-5800K is faster than a GeForce GT 440 for games, making it an outstanding solution for those willing to build an entry-level gaming system on a budget.

You have to understand, however, that depending on the game, you won’t be able to achieve a good frame rate (i.e., a good gaming experience) even when lowering all image quality settings to their minimums. From the games we ran, we achieved a terrific frame rate on StarCraft II (almost 80 frames per second), a good frame rate on FarCry 2 (around 40 frames per second), and a playable frame rate on DiRT3 (36 frames per second). However, on Battlefield 3 and Borderlands 2 the frame rate was below 20. You would also face such limitations when using entry-level video cards, and, as mentioned, the A10-5800K was faster than our entry-level GeForce GT 440.

Similarly to what we learned with the previous generation of AMD APUs, the A10-5800K lags behind its competitors in general processing performance. The Core i3-3220 is faster than the A10-5800K for day-to-day operations. Therefore, if you won’t play any games at all and want to build a powerful entry-level PC, we recommend the Core i3-3220 instead.

Reader Interactions

Leave a Reply Cancel reply

Your email address will not be published. Required fields are marked *

Primary Sidebar

As a participant in the Amazon Services LLC Associates Program, this site may earn from qualifying purchases. We may also earn commissions on purchases from other retail websites.

car service

Why Is Fleet Maintenance Important?

If you have a fleet of vehicles you use within your business, it’s crucial you keep up with their

Playing Fifa on Play station 4

Tips for Recycling Your Gaming Consoles and Devices

These days, it seems like almost everybody is gaming. As great as this is, it’s also creating a

Business planning

How to Develop Your Venture Capital Business

Venture Capital (VC) is a type of private equity investment in which investors provide funding to

Footer

For Performance

  • PCI Express 3.0 vs. 2.0: Is There a Gaming Performance Gain?
  • Does dual-channel memory make difference on integrated video performance?
  • Overclocking Pros and Cons
  • All Core i7 Models
  • Understanding RAM Timings

Everything you need to know

  • Everything You Need to Know About the Dual-, Triple-, and Quad-Channel Memory Architectures
  • What You Should Know About the SPDIF Connection (2022 Guide)
  • Everything You Need to Know About the Intel Virtualization Technology
  • Everything You Need to Know About the CPU Power Management

Copyright © 2023 · All rights reserved - Hardwaresecrets.com
About Us · Privacy Policy · Contact