AMD Radeon HD 7850 Video Card Review
Introduction
Contents
The new Radeon HD 7850 is a mid-range video card based on the latest GPU architecture from AMD, dubbed “Graphics Core Next” or simply “GCN,” which supports the new PCI Express 3.0 connection and the latest DirectX version (11.1). Let’s compare it to its main competitor, the GeForce GTX 560 Ti.
For a detailed explanation of the new features present on this new architecture, please read our Radeon HD 7970 review.
The Radeon HD 7850 and Radeon HD 7870 use the codename “Pitcairn,” which is an island in the South Pacific, matching the codename used for this new GPU architecture from AMD, “Southern Islands.”
In the table below, we compare the main specifications of the video cards included in our review. The prices listed below do not include rebates and are for the models with the clock and memory configurations listed below. Prices were researched at Newegg.com on the day we published this review, except for the Radeon HD 7850 and the Radeon HD 7870 GHz Edition, which are the prices advertised by AMD.
| Video Card | Core Clock | Shader Clock | Memory Clock (Effective) | Memory Interface |
| Radeon HD 7870 GHz Edition | 1 GHz | 1 GHz | 4.8 GHz | 256-bit |
| Radeon HD 7850 | 860 MHz | 860 MHz | 4.8 GHz | 256-bit |
| GeForce GTX 560 Ti | 822 MHz | 1,644 MHz | 4,008 MHz | 256-bit |
| Video Card | Memory Transfer Rate | Memory | Shaders | DirectX | Price |
| Radeon HD 7870 GHz Edition | 153.6 GB/s | 2 GB GDDR5 | 1,280 | 11.1 | USD 350 |
| Radeon HD 7850 | 153.6 GB/s | 2 GB GDDR5 | 1,024 | 11.1 | USD 250 |
| GeForce GTX 560 Ti | 128.3 GB/s | 1 GB GDDR5 | 384 | 11 | USD 210-245 |
You can compare the specs of these video cards with other video cards by taking a look at our “AMD ATI Chips Comparison Table” and “NVIDIA Chips Comparison Table” tutorials.
Today, only the LGA2011 Core i7 processors (“Sandy Bridge-E”) have a PCI Express 3.0 controller. Therefore, we tested the video cards using a Core i7-3960X processor on a motherboard based on the Intel X79 chipset. In our Radeon HD 7970 review, we discovered that, at this time, there is no difference between using a PCI Express 2.0 or a PCI Express 3.0 connection. We also discovered that if you are using a high-end video card, the CPU doesn’t affect gaming performance.
Now let’s take a complete look at the AMD Radeon HD 7850 reference model.
Below we have an overall look at the AMD Radeon HD 7850 reference model. It requires one six-pin auxiliary power connector.
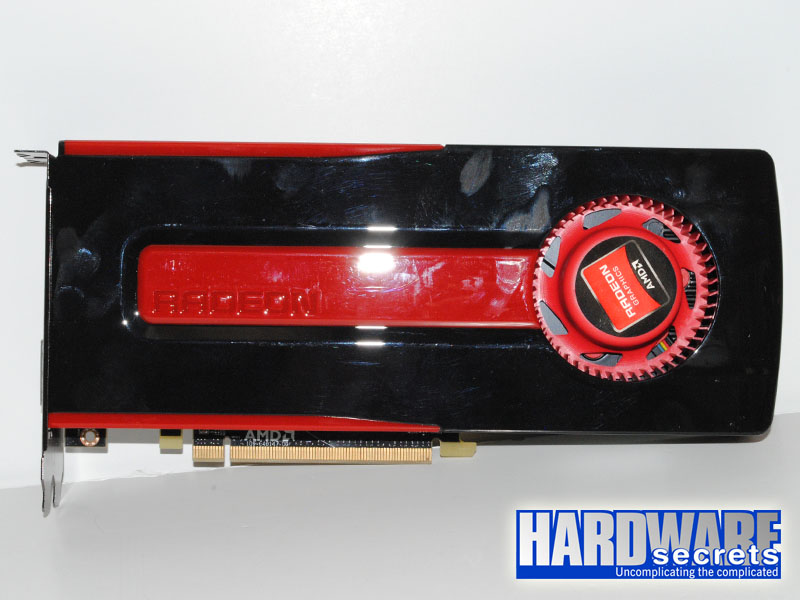
Figure 1: AMD Radeon HD 7850
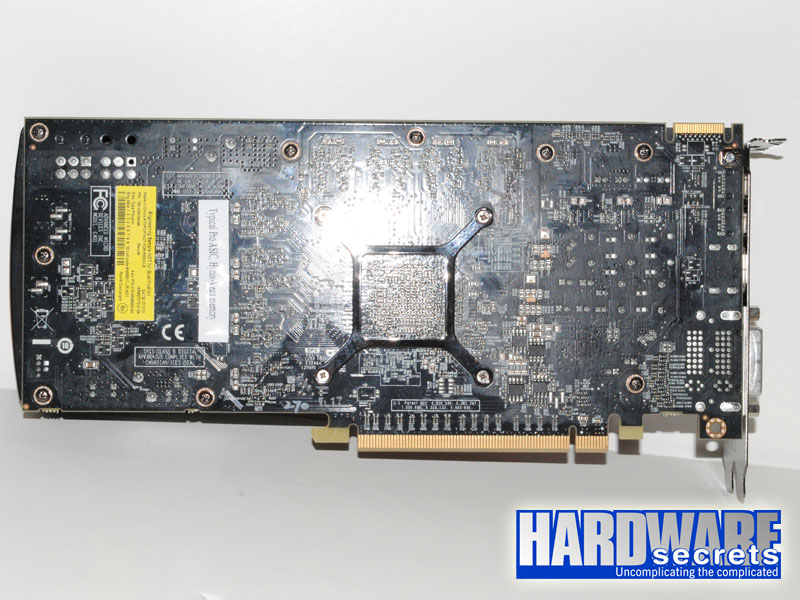
Figure 2: AMD Radeon HD 7850
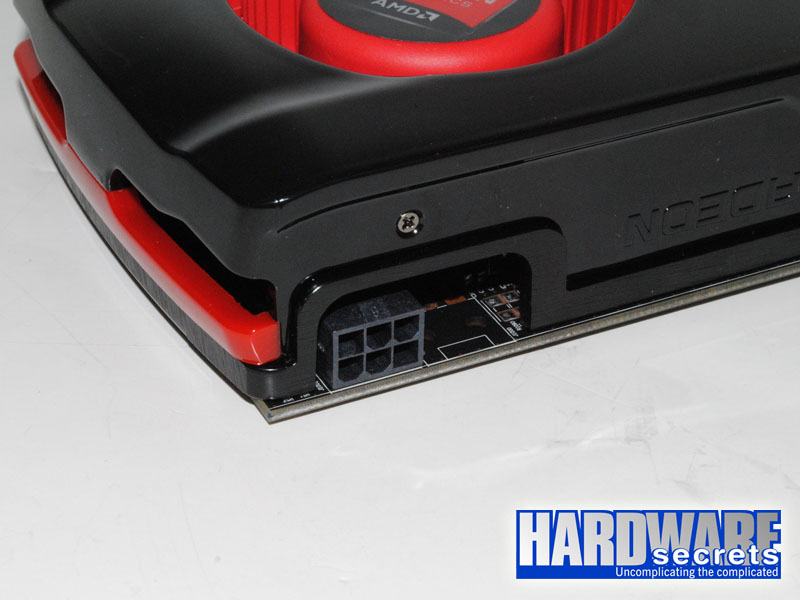
Figure 3: Auxiliary power connector
One of the highlights of this video card is the possibility of connecting up to six video monitors at the same time, which is achieved by using a DisplayPort hub or a DisplayPort monitor that provides daisy-chaining capability. The card provides one DVI-D, one HDMI, and two mini DisplayPort connectors.
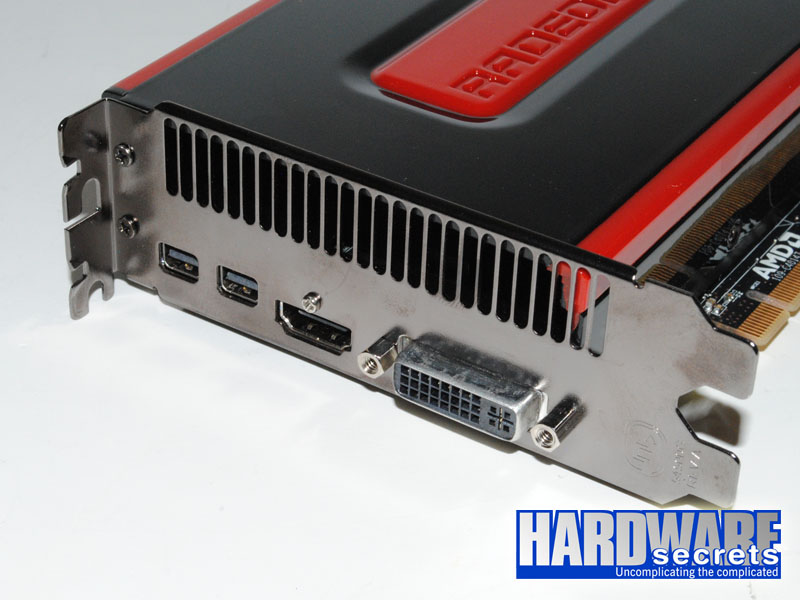
Figure 4: Video connectors
The Radeon HD 7850 uses a cooling solution identical to the one used on the Radeon HD 7870 GHz Edition, with a heatsink with aluminum fins, copper base, two 5 mm heatpipes and one 7 mm heatpipe, cooled by a 74 mm radial fan.

Figure 5: Heatsink

Figure 6: Heatsink
In Figure 7, you can see the video card with its cooler removed. The printed circuit board used on the Radeon HD 7850 is identical to the one used on the Radeon 7870 GHz Edition. The only difference between the two is the number of power connectors (two on the Radeon HD 7870 and one on the Radeon HD 7850) and the number of phases on the GPU voltage regulator. While the Radeon HD 7870 GHz Edition uses a five-phase voltage regulator, the Radeon HD 7850 uses a circuit with four phases. The voltage regulator circuit uses a digital design and is controlled by a CHiL CHL8225G chip, with each phase driven by a Renesas R2J20658BNP (“DrMOS”) chip, which incorporates the three required transistors (“high side,” “low side,” and “driver”) and can switch at higher frequencies and provide higher efficiency. All coils use ferrite cores and all capacitors are solid.

Figure 7: AMD Radeon HD 7850

Figure 8: Main voltage regulator
The reviewed video card uses eight Hynix H5GQ2H24MFR-T2C GDDR5 chips, each one storing 2 Gbit of data, making the 2 GB of memory available on this video card. Each chip is connected to the GPU through a 32-bit lane, creating the 256-bit datapath that is available. These chips can run up to 5 GHz. On this video card, they are accessed at 4.8 GHz, leaving a small 4% margin for you to increase the memory clock still within specifications. Of course, you can always try to push the memory clock above its specs.
This is the same configuration used on the Radeon HD 7870 GHz Edition.

Figure 9: Memory chips
Before seeing the performance results, let’s recap the main features of this video card.
The main specifications for the AMD Radeon HD 7850 reference model include:
- Graphics chip: Radeon HD 7850 running at 860 MHz
- Memory: 2 GB GDDR5 memory (256-bit interface) running at 4.8 GHz QDR (Hynix H5GQ2H24MFR-T2C chips)
- Bus type: PCI Express 3.0 x16
- Video Connectors: One DVI-D, one HDMI, and two mini DisplayPort
- Video Capture (VIVO): No
- Cables and adapters that come with this board: NA
- Number of CDs/DVDs that come with this board: NA
- Games included: NA
- Programs included: NA
- More information: https://www.amd.com
- MSRP in the US: USD 250.00
During our benchmarking sessions, we used the configuration listed below. Between our benchmarking sessions, the only variable was the video card being tested.
Hardware Configuration
- CPU: Core i7-3960X (3.3 GHz)
- Motherboard: Intel DX79SI (0430 BIOS)
- Memories: 16 GB DDR3-2133/PC3-1700, four G.Skill Ripjaws Z F3-17000CL9Q-16GBBZH memory modules
- Hard disk drive: Western Digital VelociRaptor WD3000GLFS (300 GB, SATA-300, 10,000 rpm, 16 MB cache)
- Video monitor: Samsung SyncMaster 305T (30” LCD, 2560×1600)
- Power Supply: Antec TruePower New 750 W
- CPU Cooler: Intel Liquid Cooling
Software Configuration
- Windows 7 Ultimate 64-bit
- Video resolution: 2560×1600 @ 60 Hz
Driver Versions
- AMD video driver version (Radeon HD 6970): Catalyst 12.1
- AMD video driver version (Radeon HD 7870): 8.95.5
- NVIDIA video driver version: 295.73
- Intel Inf driver version: 9.2.3.1022
Software Used
- 3DMark 11 Professional 1.0.3
- Aliens vs. Predator + Benchmark Tool
- Battlefield 3
- Deus Ex: Human Revolution
- DiRT3
- Far Cry 2 – Patch 1.03
- Media Espresso 6.5
- StarCraft II: Wings of Liberty – Patch 1.3.5
Error Margin
We adopted a 3% error margin. Thus, differences below 3% cannot be considered relevant. In other words, products with a performance difference below 3% should be considered as having similar performance.
StarCraft II: Wings of Liberty is a very popular DirectX 9 game that was released in 2010. Though this game uses an old version of DirectX, the number of textures that can be represented on one screen can push most of the top-end graphics cards to their limits. StarCraft II: Wings of Liberty uses its own physics engine that is bound to the CPU and thus does not benefit from PhysX.
We tested this game at 1920×1200 and 2560×1600. The quality of the game was set to the “extreme” preset. We then used FRAPS to collect the frame rate of a replay on the “Unit Testing” custom map. We used a battle between very large armies to stress the video cards.

| Starcraft II: Wings of Liberty | 1920×1200 | Difference |
| Radeon HD 7870 | 216.8 | 18% |
| Radeon HD 7850 | 183.2 | |
| GeForce GTX 560 Ti | 172.4 | 6% |

| Starcraft II: Wings of Liberty | 2560×1600 | Difference |
| Radeon HD 7870 | 179.6 | 21% |
| Radeon HD 7850 | 148.3 | |
| GeForce GTX 560 Ti | 136.5 | 9% |
Released in 2008, Far Cry 2 is based on a game engine called Dunia, which is DirectX 10. We used the benchmarking utility that comes with this game at 1920×1200 and 2560×1600, setting overall quality to “ultra high,” maximizing all image quality settings, adjusting anti-aliasing to “8x,” and running the “Ranch Long” demo three times. The results below are expressed in frames per second and are an arithmetic average of the three results collected.

| FarCry 2 | 1920×1200 | Difference |
| Radeon HD 7870 | 81.3 | 11% |
| GeForce GTX 560 Ti | 79.5 | 9% |
| Radeon HD 7850 | 72.9 |

Radeon HD 7850
| FarCry 2 | 2560×1600 | Difference |
| Radeon HD 7870 | 57.3 | 12% |
| 51.1 | ||
| GeForce GTX 560 Ti | 48.0 | 6% |
Aliens vs. Predator is a DirectX 11 game that makes full use of tessellation and advanced shadow rendering. We used the Aliens vs. Predator Benchmark Tool developed by Rebellion. This program reads its configuration from a text file. (Our configuration files can be found here.) We ran this program at 1920×1200 and 2560×1600, with texture set at “very high,” shadows set at “medium,” anisotropic filtering set at “8x,” and anti-aliasing set at “2x.”

| Aliens vs. Predator | 1920×1200 | Difference |
| Radeon HD 7870 | 49.2 | 22% |
| Radeon HD 7850 | 40.3 | |
| GeForce GTX 560 Ti | 37.0 | 9% |

| Aliens vs. Predator | 2560×1600 | Difference |
| Radeon HD 7870 | 34.6 | 42% |
| Radeon HD 7850 | 24.3 | |
| GeForce GTX 560 Ti | 22.6 | 8% |
DiRT3 is a DirectX 11 game. We measured performance using this game by running a race and then playing it back using FRAPS. We ran this game at 1920×1200 and 2560×1600 with image quality set to “ultra,” with anti-aliasing set at “8xMSAA.”

| DiRT3 | 1920×1200 | Difference |
| Radeon HD 7870 | 77.7 | 24% |
| GeForce GTX 560 Ti | 63.4 | 1% |
| Radeon HD 7850 | 62.8 |

| DiRT3 | 2560×1600 | Difference |
| Radeon HD 7870 | 56.4 | 17% |
| GeForce GTX 560 Ti | 51.4 | 6% |
| Radeon HD 7850 | 48.4 |
Deus Ex: Human Revolution is another DirectX 11 game. We used the in-game introduction to measure the number of frames per second, using FRAPS. We ran the introduction in two resolutions, 1920×1200 and 2560×1600, maximizing all image quality settings, configuring anti-aliasing as “MLAA Mode” and anisotropic filtering at “16x.”

| Deus Ex: Human Revolution | 1920×1200 | Difference |
| Radeon HD 7870 | 198.7 | 21% |
| Radeon HD 7850 | 164.8 | |
| GeForce GTX 560 Ti | 157.4 | 5% |

| Deus Ex: Human Revolution | 2560×1600 | Difference |
| Radeon HD 7870 | 138.6 | 33% |
| Radeon HD 7850 | 104.5 | |
| GeForce GTX 560 Ti | 97.5 | 7% |
Battlefield 3 is the latest installment in the Battlefield franchise released in 2011. It is based on the Frostbite 2 engine, which is DirectX 11. In order to measure performance using this game, we walked our way through the first half of the “Operation Swordbreaker” mission, measuring the number of frames per second using FRAPS. We ran this game at 1920×1200 and 2560×1600, maximizing all image quality settings, configuring anti-aliasing as “4xMSAA” and anisotropic filtering at “16x.”

| Battlefield 3 | 1920×1200 | Difference |
| Radeon HD 7870 | 50.8 | 23% |
| Radeon HD 7850 | 41.4 | |
| GeForce GTX 560 Ti | 37.4 | 11% |

| Battlefield 3 | 2560×1600 | Difference |
| Radeon HD 7870 | 38.2 | 19% |
| Radeon HD 7850 | 32.1 | |
| GeForce GTX 560 Ti | 27.6 | 16% |
3DMark 11 Professional measures Shader 5.0 (i.e., DirectX 11) performance. We ran this program at 1920×1200 and 2560×1600, selecting the four graphics tests available and deselecting the other tests available. We used two image quality settings, “performance” and “extreme,” both at their default settings. The results being compared are the “GPU Score” achieved by each video card.

| 3DMark 11 – Performance | 1920×1200 | Difference |
| Radeon HD 7870 |
3152 | 24% |
| Radeon HD 7850 |
2536 | |
| GeForce GTX 560 Ti |
2224 | 14% |

| 3DMark 11 – Performance | 2560×1600 | Difference |
| Radeon HD 7870 |
1851 | 26% |
| Radeon HD 7850 |
1467 | |
| GeForce GTX 560 Ti |
1295 | 13% |

| 3DMark 11 – Extreme | 1920×1200 | Difference |
| Radeon HD 7870 |
1817 | 24% |
| Radeon HD 7850 |
1471 | |
| GeForce GTX 560 Ti |
1346 | 9% |

| 3DMark 11 – Extreme | 2560×1600 | Difference |
| Radeon HD 7870 |
1153 | 26% |
| Radeon HD 7850 |
913 | |
| GeForce GTX 560 Ti |
811 | 13% |
Media Espresso is a video conversion program that uses the graphics processing unit of the video card to speed up the conversion process. We converted a 449 MB, 1920x1080i, 18,884 kbps, MPEG2 video file to a smaller 640×360, H.264, .MPG4 file for viewing on a portable device such as an iPhone or iPod Touch. We also ran this test on our two CPUs (Core i7-980X and Core i7-3960X) in order to compare the difference in performance of using a high-end CPU and a high-end GPU to transcode video.

| Media Espresso 6.5 | Seconds | Difference |
| Radeon HD 7870 |
34 | 6% |
| Radeon HD 7850 |
36 | |
| GeForce GTX 560 Ti |
46 | 22% |
| Core i7-3960X |
46 | 22% |
In our tests, the Radeon HD 7850 was up to 16% faster than its main competitor, the GeForce GTX 560 Ti. The only exceptions were on FarCry 2 at 1920×1200, where the video card from NVIDIA was 9% faster, (at 2560×1600, however, the video card from AMD was 6% faster), and on DiRT3 at 2560×1600, where the GeForce GTX 560 Ti was 6% faster (at 1920×1200, both achieved the same performance level).
On Media Espresso, the Radeon HD 7850 was substantially faster than the GeForce GTX 560 Ti, with an advantage of 28 percent. This shows that the new “GCN” architecture is really optimized for the processing of “regular” programs, as promised by AMD.
The Radeon HD 7850 is an excellent video card if you have USD 250 in your budget for one, and it deserves our recommendation for the savvy user who is looking for an affordable high-end video card. The GeForce GTX 560 Ti, however, has as an advantage a lower price, as it was released one year ago. It will take a while for the price of the Radeon HD 7850 to drop. The GeForce GTX 560 Ti is also a terrific option for the average user who prefers to save a little and doesn’t mind getting slightly lower performance.